How rare is a map and the atlas it comes from?
cover of the Map Collector issue 36, September 1986
HOW RARE IS A MAP AND THE ATLAS IT COMES FROM
Facts and speculations on production and survival of Ortelius' Theatrum Orbis Terrarum and its maps.
The author is Associate Professor in Phonetics at Utrecht University in the Netherlands and editor of the Journal of Phonetics. He became interested in the History of cartography after attending lectures by Professor Günter Schilder of the Geography Department at the same University and has had extensive discussions with Professor Koeman, another world-renowned expert. Marcel van den Broecke is also a map collector and a small scale dealer in Ortelius material.
COLLECTORS OF OLD maps as well as researchers into the history of cartography are regularly faced with the question: how rare is this map? There is no literature to turn to which answers this satisfactorily since reliable data is sadly lacking.
Rarity is determined by two factors - the number of maps produced by the printer and the percentage of that number which have withstood the ravages of time. The number of copies printed is primarily determined by economic considerations. The printer will not produce more copies than can be sold within a reasonable period, otherwise investments - and paper was not a cheap commodity in the sixteenth century - are wasted. Survival is determined by a number of factors. The first is age. The older the map, the smaller its chances of survival. Secondly, the size. A wall map is particularly vulnerable due to its large size and will therefore deteriorate rapidly as can be seen in any geography classroom. The third is protection. A map bound in an atlas is stored as a book and thus protected by its binding. This increased the chance of survival. The fourth is appeal. In all periods of cartography some maps have a stronger appeal than others because of the information they give and their aesthetic value. Fifthly, there is accuracy. Maps which display outdated information tend to be discarded as soon as better information becomes available. This applies particularly to the separate maps of today such as town plans or motorway maps. Lastly, there is breaking. The cutting up of atlases to sell the maps separately has caused considerable loss, not immediately of the loose maps but of the bound volume.
It is not feasible to quantify these factors determining survival but it is possible to make an inventory of atlas maps that have survived and to compare such an inventory with production data. I have attempted to do this, considering maps which are neither so common as to make an inventory of the survivors impossibly large, nor so rare that the resulting inventory becomes a collection of accidental findings.
Choice of material
The Theatrum Orbis Terrarum of Abraham Ortels or Ortelius (1527-98), an atlas which appeared in about forty editions between 1570 and 1612, meets the above requirements perfectly. It was the first modern world atlas in the sense of a collection of uniformly-sized maps covering the contemporary world, each backed with text, put together to form a coherent book.
The Theatrum was immensely popular in spite of its high price1 which accounts for its numerous editions. After the death of Ortelius the centre of cartographic activity shifted from his native Antwerp to the Northern Netherlands, notably Amsterdam. Interest in the later editions of the Theatrum dropped off, possibly due to Ortelius' outspoken interest in the geography of Roman times which led to the historical supplement to his atlas (the Parergon), sometimes issued separately. After 1612 the plates for the atlas were no longer used except for the world map.2 The same fate was shared by the Parergon after 1624. The Theatrum has been described as one of the major milestones in the history of cartography.3
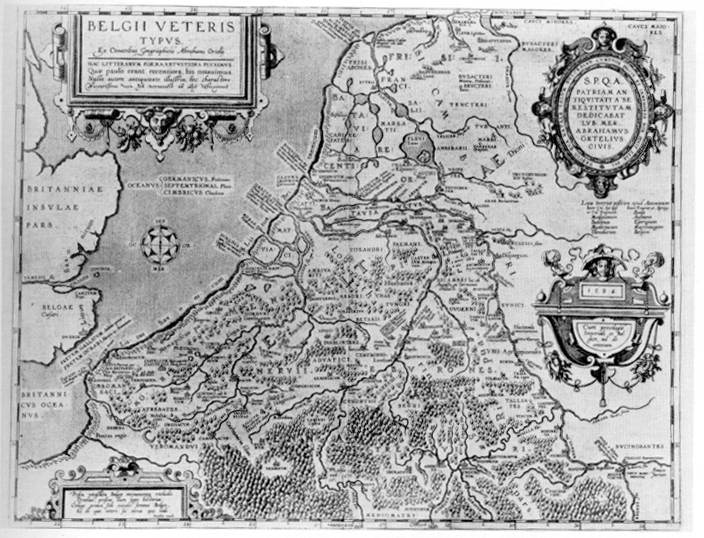
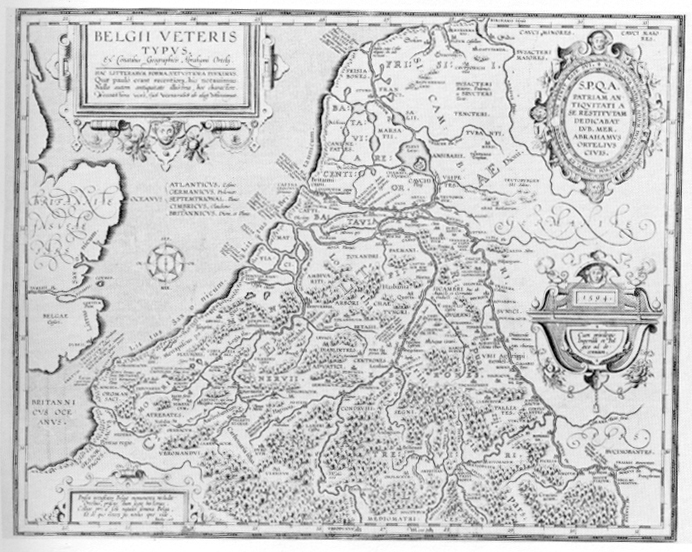
Above and below:
Some Ortelius maps were published for more than forty years. When comparing apparently identical maps it must be established if they were printed from the same plate and, if so, whether that has been reworked. The Ortelius atlas includes two versions of the historical map of the Low Countries printed from different plates. They are dated 1584 and 1594 respectively on the lower of the two cartouches at the right hand side.
METHOD AND RESULTS: ATLASES
The method described below to establish production and survival data on Ortelius' cartographic material will first be applied to his atlases and subsequently to the maps extracted from them. Ortelius is also known to have published some maps prior to the appearance of the Theatrum, but these will not be included here. Atlas edition identification and map identification is based throughout on Cornelis Koeman's Atlantes Neerlancici, Volume III, (1969), pp. 25-70. Although this does not contain the data needed for the present analysis, it does provide an excellent framework and starting-point.
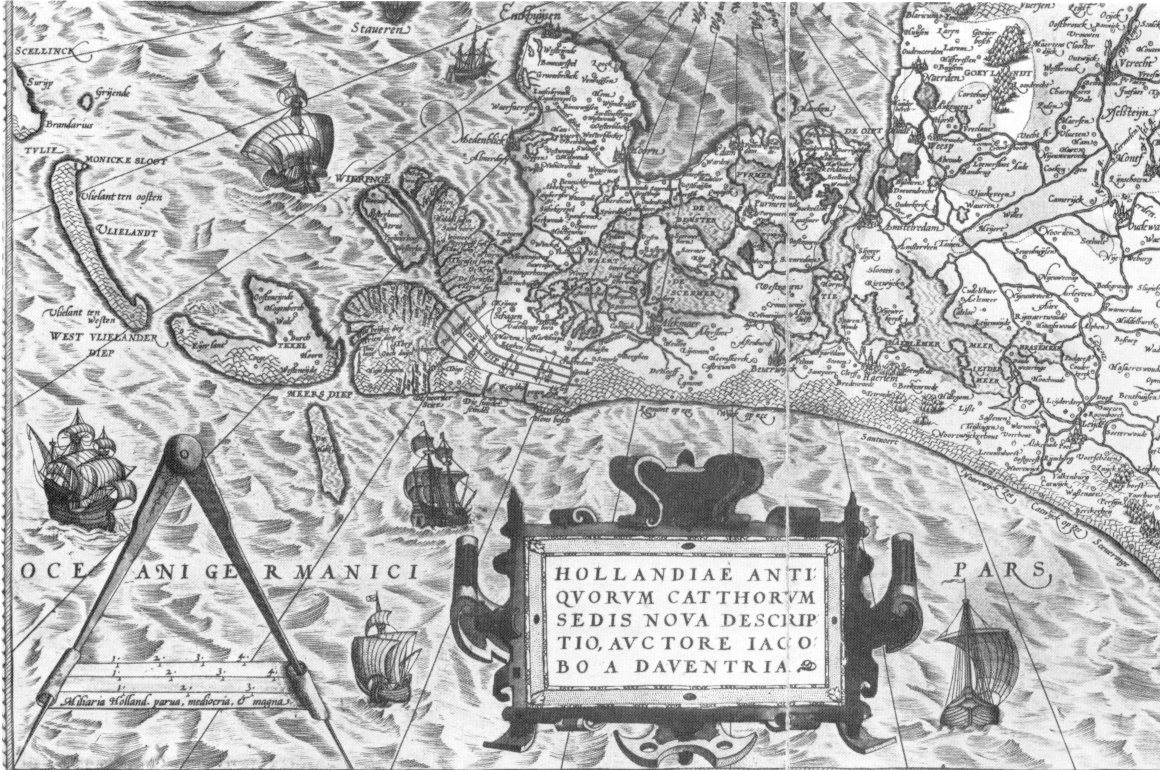
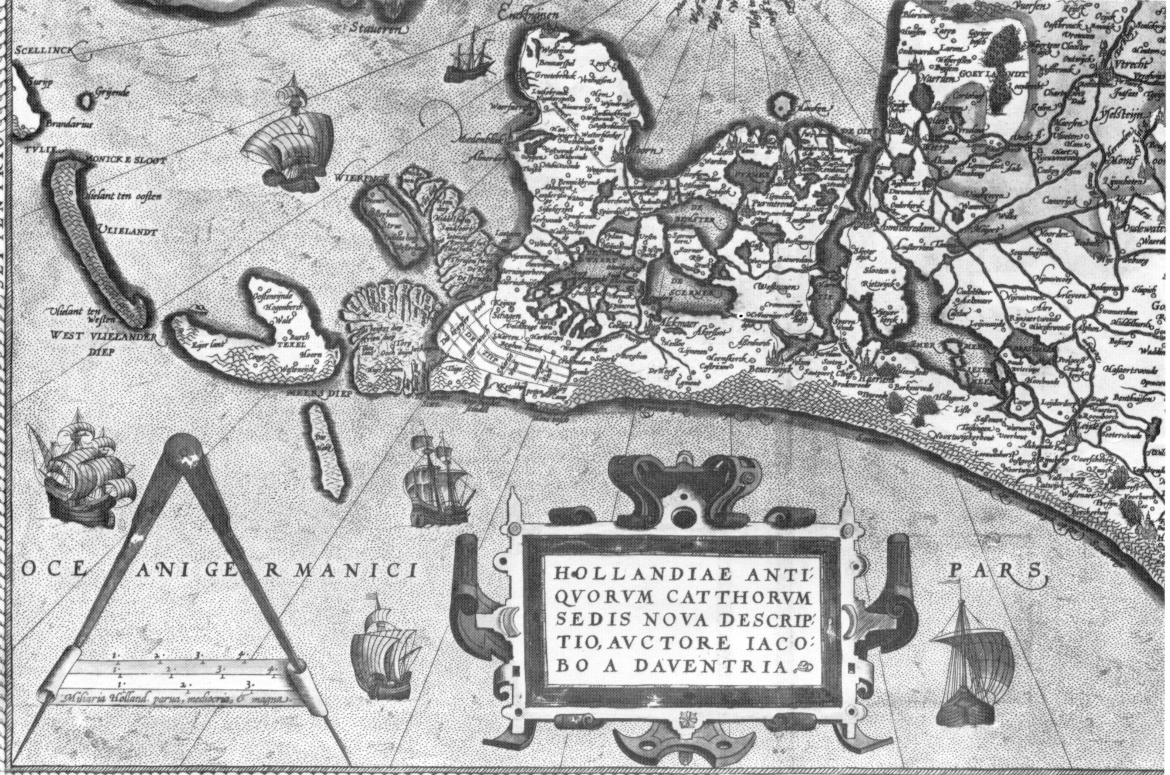
Two details of the Holland map from early (1575 Latin) and late (1603 Latin) editions of the atlas show a thorough reworking of the sea area, where the waves are replaced by stippling. The original waves are still faintly visible on the later map.
Table I: Production and survival of ortelius atlases. (Koeman distinguishes 46 editions, numbered Ort 1 to Ort 46)
| 1 | 2 | 3 | 4 | 5 | 6 | 7 | 8 | 9 |
|---|---|---|---|---|---|---|---|---|
| Koeman reference | Date of appearance and language | No. Of copies sold by Plantijn | No. of copies printed (est.) | No. Of copies extant in libraries (proved) | No. of copies in circulation 1980-1985 (proved) | No. of copies extant, private and dealers (estimate) | Total no.of copies extant (proved+estimated) | No. of copies extant as % of no. of copies printed |
| Ort 1A-D | 1570L | 159 | 325 | 29 | 7 | 41 | 70 | 21.5% |
| Ort 2 | 1571L | } { | 275 | 11 | 4 | 23 | 34 | 12.4% |
| 271 | ||||||||
| Ort 3 | 1571D | } { | 275 | 8 | 1 | 6 | 14 | 5.1% |
| Ort 4 | 1572F | } { | 150 | 4 | 3 | 17 | 21 | 14.0% |
| 138 | ||||||||
| Ort 5 | 1572G | } { | 150 | 12 | - | 7 | 19 | 12.7% |
| Ort 6 | 1573GI | } { | 50 | 2 | - | 6 | 8 | 16.0% |
| Ort 7 | 1574LI | 48 | 50 | 9 | 3 | 17 | 26 | 52.0% |
| Ort 8 | 1574FI | } { | 50 | 1 | 2 | 11 | 12 | 24.0% |
| Ort 9 | 1573L | } { | 75 | 15 | 5 | 29 | 44 | 58.7% |
| Ort 10 | 1573D | 108 | 75 | 2 | - | 6 | 8 | 10.7% |
| Ort 11 | 1573G | } { | 75 | 11 | - | 7 | 18 | 24.0% |
| Ort 12 | 1574L | 81 | 175 | 16 | 4 | 24 | 40 | 22.9% |
| Ort 13 | 1575L | 43 | 100 | 12 | 4 | 23 | 35 | 35.0% |
| Ort 14AB | 1579/80LII | 97 | 250 | 6 | - | 6 | 12 | 4.8% |
| Ort 15AB | 1579L | 194 | 500 | 20 | 4 | 24 | 44 | 8.8% |
| Ort 16A | 1580G | 100 | 200 | 10 | 3 | 18 | 28 | 14.0% |
| Ort 17 | 1581F | 234 | 500 | 7 | - | 6 | 13 | 2.6% |
| Ort 18 | 1584LIII | } { | 50 | 9 | 4 | 23 | 32 | 64.0% |
| Ort 19 | 1584GIII | ? | 50 | 5 | - | 6 | 11 | 22.0% |
| Ort 20 | 1585FIII | } { | 50 | 4 | - | 6 | 10 | 20.0% |
| Ort 21 | 1584L | 131 | 275 | 20 | 4 | 24 | 44 | 16.0% |
| Ort 22 | 1587F | 122 | 250 | 11 | 6 | 34 | 45 | 18.0% |
| Ort 16B | 1589G | 61 | 150 | 3 | - | 6 | 9 | 6.0% |
| Ort 23 | 1588S | 145 | 300 | 10 | 2 | 12 | 22 | 7.3% |
| Ort 24 | No copy known | |||||||
| Ort 25 | 1590LIV | } { | 50 | 6 | 1 | 6 | 12 | 24.0% |
| 29 | ||||||||
| Ort 26 | 1591GIV | 50 | 5 | - | 6 | 11 | 22.0% | |
| Ort 27AB | 1591/92L | } { | 300 | 26 | 4 | 25 | 51 | 17.0% |
| Ort 28 | 1595LV | 151 | 50 | 6 | - | 6 | 12 | 24.0% |
| Ort 29 | 1595L | ? | 200 | 21 | 11 | 63 | 84 | 42.0% |
| Ort 30 | 1597GV | 96 | 50 | 2 | 6 | 8 | 16.0% | |
| Ort 31/40 | 1598/1610D | ? | 100 | 11 | 4 | 23 | 34 | 34.0% |
| Ort 32 | 1598F | ? | 100 | 18 | 1 | 7 | 25 | 25.0% |
| Ort 33 | 1601L | 18 | 300 | 10 | - | 6 | 16 | 5.3% |
| Ort 34 | 1602S | - | 250 | 6 | 1 | 6 | 12 | 4.8% |
| Ort 35 | 1602G | - | 250 | 4 | - | 6 | 10 | 4.0% |
| Ort 36 | 1603L | - | 300 | 20 | 3 | 19 | 39 | 13.0% |
| Ort 37 | 1606E | - | 300 | 11 | - | 7 | 18 | 6.0% |
| Ort 38 | 1608I | - | 300 | 8 | 3 | 17 | 25 | 8.3% |
| Ort 39 | 1609L | - | 300 | 7 | - | 6 | 13 | 4.3% |
| Ort 41 | 1612L | - | 250 | 12 | - | 7 | 19 | 7.6% |
| Ort 42 | 1612I | - | 250 | 9 | - | 6 | 15 | 6.0% |
| Ort 43 | 1612S | - | 250 | 4 | - | 6 | 10 | 4.0% |
| Ort 44 | Nomenclator | - | ||||||
| Ort 45 | 1595Par | 300 | 1 | 3 | 17 | 18 | 6.0% | |
| Ort 46 | 1624Par | - | 300 | 18 | 2 | 13 | 31 | 10.3% |
| Totals | No. Of copies Printed (est) | No. of copies Extant in lib. (proved) | No. Of copies in Circulation 1980-85 (proved) | No. of copies extant, Priv. (Est.) | No. of copies extant, (proved + estimated) | No. of copies as % of no. of copies printed | ||
| Regular atlases | 7300 | 368 | 74 | 511 | 879 | 12.0% | ||
| Additamenta | 750 | 55 | 10 | 99 | 154 | 20.5% | ||
| Parergons | 600 | 19 | 5 | 30 | 49 | 8.2% | ||
Column 1. Koeman reference
Ortelius 1 comes in four different text versions (Ort1A-D) which need not concern us here. This also applies to Ort 14 (A-B), Ort 15 (A-B) and Ort 27 (A-B). Ort 6-7-8 refer to the first Additamenta, collections of additional maps which could be purchased separately, or which were bound up with the regular atlases. Ort 14 is the second Additamentum, Ort 18-19-20 the third, Ort 26 -27 the fourth and Ort 28 and 30 the fifth and last. Ort 16A and 16B are, in fact different editions, dated 1580 and 1589 respectively, and varying in their map contents. They will be treated separately. Ort 30 and Ort 31 are identical except for their imprint dates (1598 and 1610 respectively), and will be treated as one edition. Ort 24 is only known through a reference of doubtful reliability and is therefore discarded. Ort 44 is a list of place-names only, the so-called Nomenclator, which is usually incorporated in the atlas and contains no maps. Ort 45 and Ort 46 are separate Parergon atlases which appeared in 1595 and 1624. This leaves us with thirty-one regular atlas editions, eleven additamentum editions and two Parergons.
Column 2. Date of appearance and language
This column is arranged by edition date and text language. Additamenta are given Roman numerals, and the separate Parergons, which were both in Latin have received a P identification. The reason for renaming them is to provide more information per edition.
Column 3. Number of copies sold by Plantijn
Once the number and nature of the various editions has been established, we come to the crucial question: how many copies of each edition were printed? As noted before there is no information on this subject in the literature, except for an estimate by Skelton (1968) in his introduction to the English 1606 facsimile edition.4 Skelton mentions an impression number for this edition of 1,000 copies, without providing factual grounds for his estimate. We will return to this later
Although there are no straightforward records as to the number of copies of each edition, there are data from which such numbers can be derived with reasonable certainty. These data can be found in Plantijn's archives. Plantijn was the printer and publisher of most of the Theatrum editions. He operated the largest printing press in Europe at the time, and kept meticulous records of his income and expenses over the period 1558-1598. Although it is certain that Plantijn did the printing of the Theatrum from 1570 until at least 1601, Diest was the publisher until the 1575 Latin edition. We share Koeman's surprise that this should have occurred. The 1575 Latin edition was published by Aegidius Radens, and from 1579 onwards, Christoffel Plantijn (later Moretus) became the publisher. In 1602 Vrients took over the plates and did the printing as well as the publishing and started to add plates on his own. The 1612 editions and the 1624 Parergon were again published by the Plantijn house, now called Plantijn-Moretus. Plantijn's records are reproduced in Denucé. 5 Plantijn specifies for most of the years within the period 1570 to 1598 how many copies of Ortelius' atlases and Additamenta he sold (see also Koeman, 1964, pp. 39-40 for this information). Besides that, the archives contain two entries for large quantities of double folio paper which Plantijn bought for Ortelius just prior to the appearance of a new edition of his atlas. Since Ortelius financed the production of his atlases himself, it is not surprising that he should pay his printer and publisher for the paper needed for an impression of his atlas.
The first relevant entry5 specifies forty seven reams of paper in 1570. A ream comprises 500 sheets of paper, the amount one man could make in a day. It is reasonable to assume that this was the paper needed for the first Theatrum edition. The Latin edition of 1570 (1570L) contains seventy one sheets of paper, fifty three of which contain maps. Thus, forty seven reams of paper represent 47x500=23,500 sheets, enough for about 330 atlases. Assuming some paper loss in the printing process, the 1570L edition would have comprises about 325 atlases. Plantijn sold 159 copies6 or about half the total impression. The remainder were sold by others.
The next relevant entry in Plantijn's records occurs in 1579.7 This time Ortelius needed no fewer than 131 reams of paper, an impressive 65,000 sheets. Plantijn specifically mentions that this paper was required for printing the Theatrum. The next editions after this entry were the 1579/1580LII Additamentum and the 1579L regular edition. Since Plantijn sold about twice as many copies of the regular 1579L edition as of the 1579/1580LII Additamentum, it seems reasonable to assume that these sales reflect the number of copies of each of these editions printed. The 1579L atlas contains 119 sheets of paper, the 1579/1580LII Additamentum has twenty five sheets. When you divide the available 65.000 sheets in such a way that you obtain about twice as many atlases as Additamenta, the impression of the 1579L edition was about 500, and of the 1579/1580LII edition about 250. Plantijn sold 194 copies of the 1579L atlas and ninety seven copies of the 1579/1580LII Additamentum. This is not quite half of the impression, but it comes close to it. If, as our calculation suggests, Plantijn sold about half the impressions of three editions, and if these editions were nine years apart, it seems reasonable to assume that this was the case throughout the period for which his sales figures are available.
Column 4. Production estimates per edition
This column contains estimates of the number of copies per edition based on the assumption that these should be about double the amounts sold by Plantijn, as explained above. We do not have sales data for the post-1598 period, when Plantijn's records came to an end, but it is clear that with Ortelius'death, most of the impetus of the Theatrum was spent, and that impression rates of 500 copies would no longer be profitable. I have therefore lowered the estimates after this date, reducing them steadily towards the end of the Theatrum's printing history in 1612. Both editions of the Parergon have been set rather arbitrarily at 300 copies, the average rate for regular atlases.
The bottom of Table I, first column, provides an approximate answer to the question with which this section opened. According to the above line of reasoning, about 7,300 regular atlases, 750 Additamenta and 600 Parergons were produced over the lifetime of the Theatrum.
Column 5. Survival of atlases in libraries
Estimates of the production of atlases will be compared below with data and estimates of their survival. To establish how many Ortelius atlases are still extant today, three sources have been used:
- Koeman's (1969) specification with each edition where copies can be found in libraries;
- A non-systematic personal inquiry into Theatrum ownership in the major libraries, which did not yield new information as compared with the data provided by Koeman (1969);
- a highly systematic personal survey of public and private sales over Ortelius atlases over the period 1980-1985. All dealers and auction firms mentioned in The Map Collector's advertising pages and 'Collectors' Barometer' section were checked thoroughly over the period mentioned. In addition to this, some other sources, such as Book Auction Records, were consulted. The number of dealers and private individuals offering a Theatrum for sale, as shown by these records, seems negligible over the five-year period at issue. The major source proved to be auctions.
- Source 1, the libraries, yielded the number of copies of each edition that survived in libraries, as specified in column 5. Obviously, there will be libraries containing Theatrum copies that have escaped Koeman's and my own notice. Thus, the figures in column 5 are conservative.
Column 6. Survival of copies in circulation 1980-1985.
Source 3 of the previous section, atlases in circulation over the last five years, demonstrates that Ortelius atlases do circulate in substantial numbers. Of course, we should beware of counting double those atlases which were offered for sale more than once during the last five years. Due to the usually fairly extensive descriptions given on atlases of this kind and price, this could be established, and proved to be the case three times.
Column 7. Survival of all copies in circulation
The question now arises: what proportion of Ortelius'atlases in private hands or with dealers has circulated during the past five years? Auction houses estimate that an expensive work like the Theatrum, bought at an auction by a private collector, will only remain in his possession for about twenty five years. Then the owner dies and the atlas reappears at an auction. Given its price, most collectors will not acquire it early in life, if at all. This means that over the five-year period concerned, about 20% of all privately owned atlases will have circulated. If you, therefore, multiply by a factor of five the number of atlases known to have circulated you obtain a reasonable estimate of the total number of privately owned Ortelius atlases. Yet, those atlases which were traded between dealers, and those remaining in private hands beyond the twenty five year limit, have been excluded from the present count. My personal impression is that these two categories together add a further 10% to the estimate set out in Table I, column 7.
Column 8. Total number of atlases extant
When we add to the number of atlases in circulation (proved and estimated) the number of atlases present in libraries (proved), we obtain an estimate of the total number of atlases extant. It turns out that this reasoning leads to an estimate of 879 surviving atlases. 154 Additamenta and forty nine Parergons.
Column 9. Survival percentage
The number of surviving atlases (proved and estimated) can be divided by the number of atlases printed to obtain an idea about survival percentage. This has been done in column 9 of Table 1 for each edition. It turns out (Table 1, bottom) that about 12% of the regular atlases, 20% of the Additamenta and 8% of the Parergons have survived. These numbers may indicate that the number of Additamenta printed has been somewhat underestimated, leading to an unusually high survival rate, and conversely, that the Parergon estimates have been somewhat too high, resulting in an unduly low survival rate.
METHOD AND RESULTS: SEPARATE MAPS
Most map collectors do not collect atlases, but maps. Therefore, it is also of interest to trace production and survival of individual Ortelius maps. To achieve that, information from the preceding sections as contained in Table 1 will provide an indispensable basis. All individual maps in circulation come from broken up atlases, except for a few copies without text on the verso. These must either date from before the first atlas edition in 1570, when loose map sheets are known to have been sold, they represent the occasional loose map sales later on, or they derive from composite atlases. About 1% of the Ortelius maps in circulation which I have personally examined are blank on the verso.
The practice of breaking up atlases to sell the individual maps separately was inspired by the simple fact that this yielded a greater profit and widened the circle of potential customers. The second reason for breaking up atlases still applies, the first no longer. An Ortelius atlas in good condition is now worth more than the sum of its maps. Sometimes the condition of an atlas makes restoration impracticable, in which case breaking still occurs, and the unaffected maps are offered separately.
Before going into production and survival of in dividual Ortelius maps, a few remarks will have to be made about Ortelius’ map inventory as provided by Koeman (1969). He forst numbers the maps from the 1570 edition and then continues to embrace each new map as it appears. Thus, Koeman arrives at a total of 159 different maps for the regular atlases and Additamenta, and forty seven for the Parergon. Sometimes an asterisk is added to a map number to indicate reworking of the plate.
It is necessary to establish how many impressions can be obtained from a copperplate before it needs recutting because of plate wear, when the grooves become too shallow and the resulting lines become faint and ill-defined. Koeman (personal communication) gives about 1,000 prints as a reasonable limit. Professor D. Woodward, co-author of the History of Cartography, comes up with a similar estimate. Both authorities agree that information of this nature cannot be obtained with any degree of acceptable precision from sources within the field of the history of cartography, but should rather be gathered from typographical specialists experienced in printing with copper plates. Informal investigations in this field confirm that the upper limit of copies that can be pulled from an intaglio copper plate without recutting is indeed about 1,000. This means that all Ortelius plates from which more than a thousand impressions were obtained needed recutting, with a fair chance of alterations being introduced in the course of this process. It is beyond the scope of this paper to ascertain the moment and nature of recutting of each of Ortelius' plates.
The various states of each map are not treated systematically by Koeman, and in a number of cases the introduction of an entirely new plate is not recorded by Koeman at all. Some instances are the World map, for which Koeman distinguishes two plates (1 and 113) without mentioning different states, whereas Shirley8 identifies three plates, running altogether seven states; other instances are maps 6P 'Belgii veteris Typus', printed from a new, redated plate from 1594 onwards, and map 84, 'Frisia Orientalis', which occurs in two different versions. Other documented plate and map histories include map 6, 'Angliae, Scotiae et Hiberniae9, map 51, 93, and 106, 'The Holy Land'10 map 45, 'Septentrionalium Regionem'11 and maps 41, 42, 43, 71, 91, 23P and 30P, covering Hungary and Southeast Europe12 to mention a few.
For convenience, the Koeman numbering system will be retained, even when different plates or states have the same plate number. Plate 146 is a reappearance of plate 116 and deserves for that reason no separate treatment. Plates 40 and 41, 'Ordines Sacri', were used by de Jode in the 1593 edition of his Speculum atlas before they were included in the Theatrum from 1603 onwards.
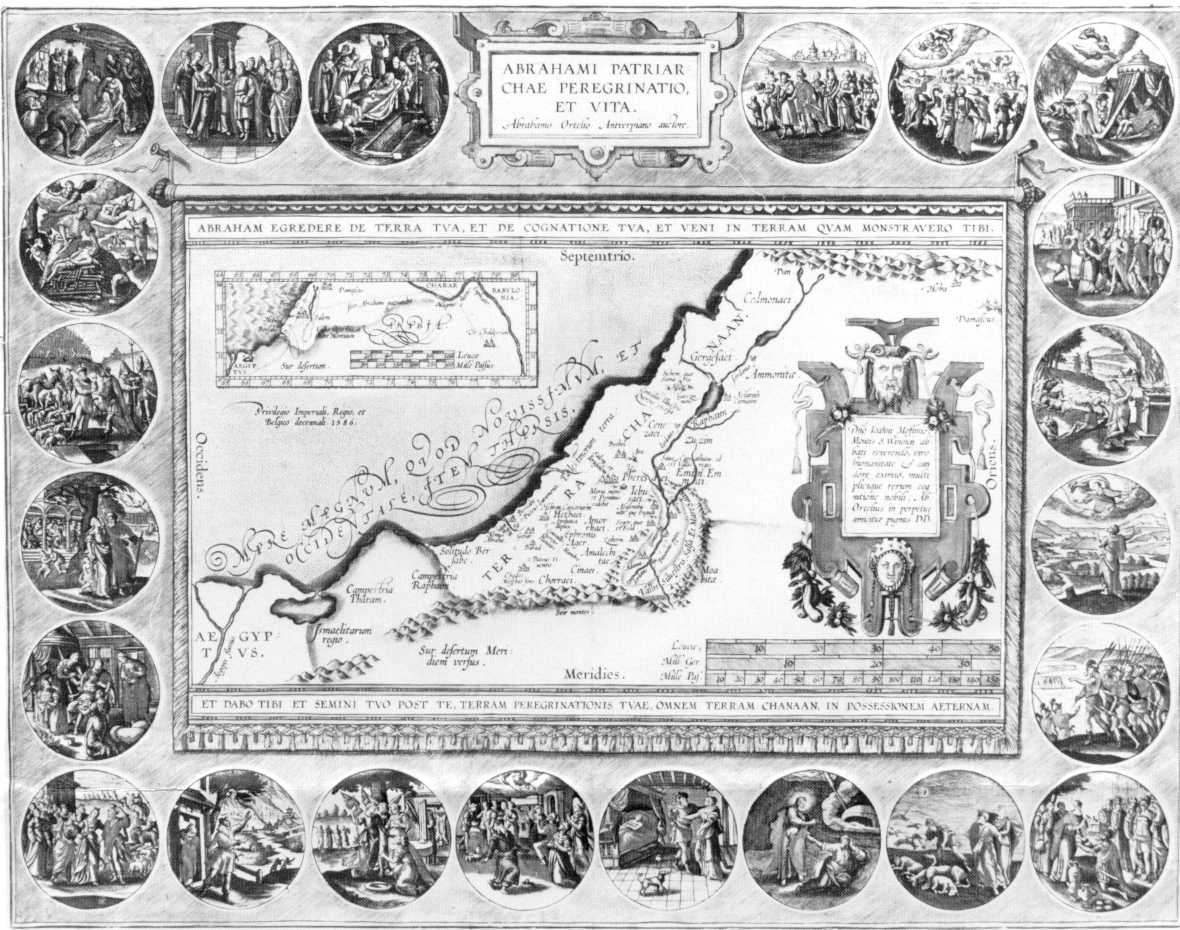
Detailed research by the author produces figures which bring the vulnerability of the printed map forcibly to our attention. For instance, he estimates that only approximately ten percent of the "Travels of Abraham", published in Ortelius’ Parergon, now survive.
TABLE II: PRINTING HISTORY OF INDIVIDUAL ORTELIUS MAPS
| 1 | 2 | 3 | 4 | 5 | 6 | 7 | 8 | 9 |
|---|---|---|---|---|---|---|---|---|
| Koeman reference | Period of use | No. of copies printed (estimate) | No. of copies extant in atlases (proved) | No. of copies extant in atlases (estim.) | No. of copies of loose maps circul. 1980–1985 | No. of coipies of loose maps circul. (total est.) | Total no. of loose maps (est. + proved) | No. of copies extant as % of no. of those printed |
| 1. Typus Orbis | 1570L–1584L | 3250 | 231 | 421 | 41 | 236 | 657 | 20.2% |
| 2. Americae | 1570L–1584L | 3250 | 231 | 421 | 38 | 219 | 640 | 19.7% |
| 3. Asiae | 1570L–1612S | 7300 | 443 | 809 | 61 | 351 | 1160 | 15.9% |
| 4. Africae | 1570L–1612S | 7300 | 443 | 809 | 55 | 316 | 1125 | 15.4% |
| 5. Europae | 1570L–1581F | 3025 | 195 | 355 | 33 | 190 | 545 | 18.0% |
| 6. Angl. Sc. Hib. | 1570L–1612S | 7300 | 443 | 809 | 52 | 299 | 1108 | 15.2% |
| 7. R. Hispaniae | 1570L–1612S | 7300 | 443 | 809 | 27 | 155 | 964 | 13.2% |
| 8. Portugalliae | 1570L–1612S | 7300 | 443 | 809 | 37 | 213 | 1022 | 14.0% |
| 9. Galliae | 1570L–1603L | 5650 | 389 | 711 | 18 | 104 | 815 | 14.4% |
| 10. Biturg.-Liman | 1570L–1612S | 7200 | 428 | 781 | 30 | 173 | 954 | 13.3% |
| 11. Calet.-Veromand. | 1570L–1598D | 4450 | 326 | 595 | 28 | 161 | 756 | 17.0% |
| 12. Gall.-Sabaud. | 1570L–1581F | 3025 | 195 | 355 | 11 | 63 | 418 | 13.8% |
| 13. Germania | 1570L–1602G | 5350 | 366 | 669 | 21 | 121 | 790 | 14.8% |
| 14. German. Inferor. | 1570L–1612S | 7000 | 432 | 789 | 24 | 138 | 927 | 13.2% |
| 15. Gelriae, Cliviae | 1570L–1612S | 7300 | 443 | 809 | 39 | 225 | 1034 | 14.2% |
| 16. Brabantiae | 1570L–1592L | 4150 | 278 | 507 | 17 | 98 | 605 | 14.6% |
| 17. Flandria | 1570L–1592L | 4150 | 278 | 507 | 15 | 86 | 593 | 14.3% |
| 18.Zeelandicarum | 1570L–1612S | 7300 | 443 | 809 | 25 | 144 | 953 | 13.1% |
| 19. Hollandiae Cat. | 1570L–1612S | 7300 | 443 | 809 | 28 | 161 | 970 | 13.3% |
| 20. Oost-West Friesland | 1570L–1612S | 7300 | 443 | 809 | 29 | 167 | 976 | 13.4% |
| 21. Daniae R. | 1570L–1581F | 3025 | 195 | 355 | 9 | 52 | 407 | 13.5% |
| 22. Thietmars.-Pruss. | 1570L–1581F | 3025 | 195 | 355 | 22 | 127 | 482 | 15.9% |
| 23. Saxon. Misn. Thur. | 1570L–1612S | 7300 | 443 | 809 | 44 | 253 | 1062 | 14.5% |
| 24. Franc.-Monaster. | 1570L–1612S | 7300 | 443 | 809 | 25 | 144 | 925 | 12.8% |
| 25. R. Bohemiae | 1570L–1612S | 7300 | 443 | 809 | 28 | 161 | 970 | 13.3% |
| 26 Silesiae | 1570L–1612S | 7300 | 443 | 809 | 23 | 132 | 941 | 12.9% |
| 27. Austriae | 1570L–1598D | 4450 | 326 | 595 | 36 | 207 | 802 | 18.0% |
| 28. Salisburgensis | 1570L–1612S | 7200 | 428 | 781 | 25 | 144 | 925 | 12.8% |
| 29. Typus Vindelicae | 1570L–1573G | 1250 | 109 | 200 | 5 | 29 | 229 | 18.3% |
| 30. Bavar. Wirtemberg | 1570L–1581F | 2875 | 192 | 351 | 26 | 150 | 501 | 17.4% |
| 31. Helvetiae | 1570L–1612S | 7300 | 443 | 809 | 34 | 196 | 1005 | 13.8% |
| 32. Italiae | 1570L–1581F | 2875 | 192 | 351 | 16 | 92 | 443 | 15.4% |
| 33. Duc. Mediolanensis | 1570L–1612S | 7300 | 443 | 809 | 13 | 75 | 884 | 12.1% |
| 34. Pedemontanae | 1570L–1612S | 7300 | 443 | 809 | 23 | 132 | 941 | 12.9% |
| 35. Lac.-Rom.-Friuli | 1570L–1612S | 7300 | 443 | 809 | 18 | 104 | 913 | 12.5% |
| 36. Thusciae | 1570L–1612S | 7300 | 443 | 809 | 23 | 132 | 941 | 12.9% |
| 37. Regn. Neapolitani | 1570L–1612S | 7300 | 443 | 809 | 19 | 109 | 918 | 12.6% |
| 38. Insular. Aliquot | 1570L–1612S | 7300 | 443 | 809 | 24 | 138 | 947 | 14.6% |
| 39. Cyprus-Candia | 1570L–1581F | 3025 | 195 | 355 | 15 | 86 | 441 | 14.6% |
| 40. Graeciae | 1570L–1612S | 7300 | 443 | 809 | 33 | 190 | 999 | 13.7% |
| 41. Schlavon. Croat. Car. | 1570L–1612S | 7225 | 441 | 805 | 24 | 138 | 943 | 13.1% |
| 42. Hungariae | 1570L–1612S | 7300 | 443 | 809 | 30 | 173 | 982 | 13.5% |
| 43. Transsylvania | 1570L–1612S | 7300 | 443 | 809 | 25 | 144 | 953 | 13.1% |
| 44. Poloniae | 1570L–1612S | 7300 | 443 | 809 | 36 | 207 | 1016 | 13.9% |
| 45. Septentrion. R. | 1570L–1612S | 7300 | 443 | 809 | 39 | 224 | 1033 | 14.2% |
| 46. Russiae | 1570L–1612S | 7300 | 443 | 809 | 24 | 138 | 947 | 13.0% |
| 47.Tartariae | 1570L–1612S | 7300 | 443 | 809 | 48 | 276 | 1085 | 14.9% |
| 48.Indiae Orient. | 1570L–1612S | 7300 | 443 | 791 | 30 | 173 | 964 | 13.7% |
| 49 Persici R. | 1570L–1612S | 7300 | 443 | 809 | 43 | 247 | 1056 | 14.5% |
| 50. Turcici Imp. | 1570L–1575L | 1675 | 148 | 271 | 21 | 121 | 392 | 23.4% |
| 51. Palestinae | 1570L–1575L | 1675 | 148 | 271 | 16 | 92 | 363 | 21.7% |
| 52.Nat.-Aeg.-Carth. | 1570L–1612S | 7300 | 443 | 809 | 31 | 178 | 987 | 13.5% |
| 53. Barbariae et Bil. | 1570L–1612S | 7300 | 443 | 809 | 35 | 201 | 1010 | 13.8% |
| 54. Scotiae | 1573GI–1612S | 6275 | 381 | 695 | 35 | 201 | 896 | 14.3% |
| 55. Angliae R. | 1573GI–1612S | 5975 | 365 | 667 | 32 | 184 | 851 | 14.2% |
| 56. Cambriae Typus | 1573GI–1612S | 6275 | 381 | 695 | 30 | 173 | 868 | 13.8% |
| 57. Hiberniae | 1573GI–1612S | 5975 | 365 | 667 | 28 | 161 | 828 | 13.9% |
| 58. Mansfeldiae. | 1573GI–1612S | 5850 | 361 | 659 | 35 | 201 | 860 | 14.7% |
| 59. Thuring.-Misniae | 1573GI–1612S | 5900 | 383 | 700 | 25 | 144 | 844 | 14.3% |
| 60. Moraviae | 1573GI–1612S | 5775 | 368 | 672 | 35 | 201 | 873 | 15.1% |
| 61. Basil.-Sueviae | 1573GI–1612S | 6175 | 366 | 669 | 46 | 265 | 934 | 15.1% |
| 62. Rhetiae-Goritiae | 1573GI–1612S | 6175 | 366 | 669 | 24 | 138 | 807 | 13.1% |
| 63. Friuli | 1573GI–1612S | 6175 | 366 | 669 | 14 | 81 | 750 | 12.1% |
| 64. Patav.-Apuliae | 1573GI–1602G | 3475 | 233 | 426 | 11 | 63 | 489 | 14.1% |
| 65. Senen.-Cors.-Anc. | 1573GI–1612S | 6275 | 381 | 695 | 30 | 173 | 868 | 13.8% |
| 66. Cypri Ins. | 1573GI–1612S | 6175 | 366 | 669 | 33 | 190 | 859 | 13.9% |
| 67. Carint.-Histr.-Zar. | 1573GI–1612S | 6175 | 366 | 669 | 27 | 155 | 824 | 13.3% |
| 68. Pomm.-Liv.-Osw. | 1573GI–1612S | 6275 | 381 | 695 | 38 | 219 | 914 | 14.6% |
| 69. Presb. Ioanni | 1573GI–1612S | 6275 | 381 | 695 | 32 | 184 | 879 | 14.0% |
| 70. Bavariae | 1573LI–1612S | 6100 | 376 | 686 | 25 | 144 | 830 | 13.6% |
| 71. Illyricum | 1573LI–1612S | 6000 | 346 | 631 | 21 | 121 | 752 | 12.5% |
| 72. Hispaniae Nova | 1579LII–1612S | 5875 | 301 | 550 | 34 | 196 | 746 | 12.7% |
| 73. Culic.-Hisp.-Cub. | 1579LII–1612S | 5875 | 301 | 550 | 29 | 167 | 717 | 12.2% |
| 74. Hispalensis Conv. | 1579LII–1612S | 5875 | 301 | 550 | 17 | 98 | 648 | 11.0% |
| 75. Pictonum | 1579LII–1612S | 5875 | 301 | 550 | 22 | 127 | 677 | 11.5% |
| 76. Anjou | 1579LII–1612S | 5775 | 286 | 523 | 23 | 132 | 655 | 11.3% |
| 77. Picardiae | 1579LII–1612S | 5875 | 301 | 550 | 19 | 109 | 659 | 11.2% |
| 78. Burgundiae | 1579LII–1612L | 4725 | 258 | 471 | 21 | 121 | 592 | 12.5% |
| 79. Lutzenburg | 1579LII–1612S | 5625 | 297 | 542 | 35 | 201 | 743 | 13.2% |
| 80. Namurcum | 1579LII–1612S | 5875 | 301 | 550 | 19 | 109 | 659 | 11.2% |
| 81. Hannonia | 1579LII–1581F | 1450 | 50 | 91 | 14 | 81 | 172 | 11.9% |
| 82. Artois | 1579LII–1584F | 1725 | 54 | 99 | 15 | 86 | 185 | 10.7% |
| 83. Frisiae Occid. | 1579LII–1612S | 5875 | 301 | 550 | 24 | 138 | 688 | 11.7% |
| 84. Frisiae Orient. | 1579LII–1612S | 5875 | 301 | 550 | 25 | 144 | 694 | 11.8% |
| 85 Westphaliae | 1579LII–1612S | 5875 | 301 | 550 | 20 | 115 | 665 | 11.3% |
| 86. Hassiae-Holsatiae | 1579LII–1612S | 5775 | 286 | 523 | 22 | 127 | 650 | 11.3% |
| 87. Bughav.-Waldec. | 1579LII–1612S | 5775 | 286 | 523 | 25 | 144 | 667 | 11.5% |
| 88. Wirtembergens. | 1579LII–1612S | 5775 | 286 | 523 | 16 | 92 | 615 | 10.5% |
| 89. Veronae | 1579LII–1612S | 5775 | 286 | 523 | 11 | 63 | 586 | 10.1% |
| 90. Cremonensis | 1579LII–1612S | 5775 | 286 | 523 | 10 | 58 | 581 | 10.1% |
| 91. Ungariae | 1579LII–1612S | 5775 | 286 | 523 | 17 | 98 | 621 | 10.8% |
| 92. Turcici Imp. | 1579L–1612S | 5625 | 297 | 542 | 16 | 92 | 634 | 11.3% |
| 93. Palestinae | 1579L–1624P | 5325 | 267 | 487 | 32 | 184 | 671 | 12.6% |
| 94. Pal. Bavar.-Argent. | 1584LIII–1612S | 4475 | 258 | 471 | 25 | 144 | 615 | 13.7% |
| 95. Acores | 1584LIII–1612S | 4425 | 270 | 493 | 28 | 161 | 658 | 14.9% |
| 96. Burgund. Infer. | 1584LIII–1612S | 4075 | 248 | 453 | 14 | 81 | 534 | 13.1% |
| 97. Chinae | 1584LIII–1612S | 4425 | 270 | 493 | 25 | 144 | 637 | 14.4% |
| 98. Candia-Archipel. | 1584LIII–1612S | 4425 | 270 | 493 | 26 | 150 | 643 | 15.5% |
| 99. Arpet.-Vardus.-C. | 1584LIII–1612S | 4425 | 270 | 493 | 24 | 138 | 631 | 14.3% |
| 100. Leodiensis | 1584LIII–1612S | 4425 | 270 | 493 | 17 | 98 | 591 | 13.4% |
| 101.Daniae-Oldenb. | 1584LIII–1612S | 3975 | 227 | 415 | 12 | 69 | 484 | 12.2% |
| 102. Perusini | 1584LIII–1612S | 4375 | 255 | 456 | 10 | 58 | 523 | 12.0% |
| 103. Peruv.-Florida | 1584LIII–1612S | 4425 | 270 | 493 | 23 | 132 | 625 | 14.1% |
| 104. Prussiae Regn. | 1584LIII–1595L | 1575 | 153 | 279 | 12 | 69 | 348 | 22.1% |
| 105. Romainae | 1584LIII–1612S | 4375 | 255 | 465 | 19 | 109 | 574 | 13.1% |
| 106. Terra Sancta | 1584LIII–1612S | 4425 | 270 | 493 | 30 | 173 | 666 | 15.1% |
| 107. Valentiae Regn. | 1584LIII–1612S | 4375 | 255 | 465 | 21 | 121 | 586 | 13.4% |
| 108. Gall.N.-Sab.-Ven. | 1584LIII–1612S | 4375 | 270 | 493 | 24 | 138 | 631 | 14.4% |
| 109. Thietmars.-Rug. | 1584LIII–1612S | 4375 | 270 | 493 | 28 | 161 | 654 | 14.9% |
| 110. Europae | 1584L–1612S | 4275 | 248 | 453 | 10 | 58 | 511 | 12.0% |
| 111. Hannoniae | 1584L–1612S | 4175 | 247 | 451 | 6 | 35 | 486 | 11.6% |
| 112. Italiae | 1584L–1612S | 4425 | 251 | 459 | 3 | 17 | 476 | 10.8% |
| 113. Typus Orbis | 1587F–1612S | 3850 | 216 | 395 | 28 | 161 | 556 | 14.4% |
| 114. Americae | 1587F–1612S | 4150 | 227 | 416 | 36 | 207 | 623 | 15.0% |
| 115. Artesia | 1587F–1612S | 3900 | 223 | 407 | 8 | 46 | 453 | 11.6% |
| 116. Burgundia | 1589G & 1603L | 450 | 26 | 51 | 5 | 29 | 80 | 17.8% |
| 117. Aprutti | 1590LIV–1612S | 3450 | 192 | 351 | 6 | 35 | 386 | 11.2% |
| 118. Brandenburg | 1590LIV–1612S | 3550 | 207 | 378 | 17 | 98 | 476 | 13.4% |
| 119. Bresciano | 1590LIV–1612S | 3450 | 192 | 351 | 7 | 40 | 391 | 11.3% |
| 120. Ischia | 1590LIV–1612S | 3550 | 207 | 378 | 10 | 58 | 436 | 12.3% |
| 121. Islandia | 1590LIV–1612S | 3200 | 184 | 336 | 18 | 104 | 440 | 13.8% |
| 122. Lorraine | 1590LIV–1612S | 3550 | 207 | 378 | 14 | 81 | 459 | 12.9% |
| 123. Brauns.-Norimb. | 1590LIV–1612S | 3050 | 194 | 354 | 26 | 150 | 504 | 16.5% |
| 124. M.Pacifici | 1590LIV–1612S | 3550 | 207 | 378 | 27 | 155 | 533 | 15.0% |
| 125. Flandria | 1592L–1612S | 3450 | 195 | 356 | 6 | 35 | 391 | 11.3% |
| 126. Brabantia | 1592L–1612S | 3450 | 195 | 356 | 5 | 29 | 385 | 11.2% |
| 127 Cenoman.-Neustr. | 1595L–1612S | 2800 | 135 | 246 | 10 | 58 | 304 | 10.9% |
| 128 Provinciae | 1595L–1612S | 3150 | 158 | 288 | 9 | 52 | 340 | 10.8% |
| 129. Henneb.-Hassiae | 1595L–1612S | 2500 | 128 | 233 | 12 | 69 | 302 | 12.1% |
| 130. Daniae-Cimbric. | 1595L–1612S | 2900 | 150 | 274 | 9 | 52 | 326 | 11.2% |
| 131. Patav.-Tarvisi | 1595L–1612S | 2800 | 135 | 246 | 8 | 46 | 292 | 10.4% |
| 132. Florentini | 1595L–1612S | 3150 | 158 | 288 | 10 | 58 | 346 | 11.0% |
| 133. Apul.-Calabriae | 1595L–1612S | 2800 | 135 | 246 | 8 | 46 | 292 | 10.4% |
| 134. Japoniae | 1595L–1612S | 3250 | 173 | 316 | 23 | 132 | 448 | 13.8% |
| 135. Fessae et Maroch. | 1595L–1612S | 3250 | 173 | 316 | 15 | 86 | 402 | 12.4% |
| 136. Isle de France | 1598F–1612S | 2850 | 117 | 213 | 8 | 46 | 259 | 9.1% |
| 137. Tourraine | 1598F–1612S | 2850 | 117 | 213 | 5 | 29 | 242 | 8.5% |
| 138. Blais.-Lemovic | 1598F–1612S | 2850 | 117 | 213 | 8 | 46 | 259 | 9.1% |
| 139. Calet.-Veromand. | 1598F–1612S | 2950 | 132 | 241 | 5 | 29 | 270 | 9.2% |
| 140. Austria | 1598F–1612S | 2550 | 114 | 208 | 6 | 35 | 243 | 9.5% |
| 141. Prussiae | 1598F–1612S | 2850 | 117 | 213 | 5 | 29 | 242 | 8.5% |
| 142. Burgund. Duc.-Com. | 1602S–1612S | 1300 | 39 | 71 | 3 | 17 | 88 | 6.8% |
| 143. Angliae Regnum | 1603L only | 300 | 23 | 39 | 3 | 17 | 56 | 18.7% |
| 144. Catalonia | 1603L–1612S | 1350 | 59 | 108 | 6 | 35 | 143 | 10.6% |
| 145. Galizia | 1598D–1612S | 1750 | 85 | 155 | 6 | 35 | 190 | 10.9% |
| 146. Identical with plate 116 | ||||||||
| 147. Deutschland | 1603L–1612S | 2050 | 77 | 141 | 11 | 63 | 204 | 10.0% |
| 148. Angl.-Hibern. | 1606E–1612S | 1650 | 54 | 99 | 3 | 17 | 116 | 7.0% |
| 149. Irland | 1606E–1612S | 1350 | 47 | 86 | 3 | 17 | 103 | 7.6% |
| 150. Gallia | 1606E–1612S | 1400 | 50 | 91 | 2 | 12 | 103 | 7.4% |
| 151. Limburg | 1606E–1612S | 1350 | 47 | 86 | 9 | 52 | 138 | 10.2% |
| 152. Lac leman | 1608I–1612S | 1050 | 36 | 66 | 3 | 17 | 83 | 7.9% |
| 153. German. Infer. | 1608I–1612S | 1050 | 36 | 66 | 5 | 29 | 95 | 9.0% |
| 154. Bonon.-T.Vicens. | 1608I–1612S | 1050 | 36 | 66 | 3 | 17 | 83 | 7.9% |
| 155. Ep. Genuensis | 1608I–1612S | 1050 | 36 | 66 | 3 | 17 | 83 | 7.9% |
| 156. Parma et Plac. | 1608I–1612S | 1050 | 36 | 66 | 3 | 17 | 83 | 7.9% |
| 157. Duc. Ferrari | 1608I–1612S | 1050 | 36 | 66 | 3 | 17 | 83 | 7.9% |
| 158. Romegna | 1608I–1612S | 1050 | 36 | 66 | 6 | 35 | 101 | 9.6% |
| 159. Duc. Urbini | 1608I–1612S | 1050 | 36 | 66 | 5 | 29 | 95 | 9.0% |
| All regular atlas maps | 730.625 | 42.419 | 77.465 | 3.267 | 18.805 | 96.270 | 13.2% | |
| THE PARERGON MAPS | ||||||||
| 1P. Peregr. Pauli | 1579LII–1624P | 6025 | 303 | 553 | 23 | 131 | 684 | 11.4% |
| 2P. Romani Imperium | 1579LII–1624P | 6025 | 303 | 553 | 17 | 98 | 651 | 10.8% |
| 3P. Hellas, Graec. S. | 1579LII–1624P | 5625 | 296 | 540 | 19 | 109 | 649 | 11.5% |
| 4P. Aegyptus (North) | 1584LIII–1592L | 975 | 93 | 169 | 6 | 35 | 204 | 20.9% |
| 5P. Aegyptus (South) | 1584LIII–1592L | 975 | 93 | 169 | 6 | 35 | 204 | 20.9% |
| 6P. Belgii Vet. T. | 1584LIII–1624P | 4025 | 218 | 398 | 15 | 86 | 484 | 12.0% |
| 7P. Creta-Ins. Aliq. | 1584LIII–1624P | 4275 | 241 | 440 | 17 | 98 | 538 | 12.6% |
| 8P. Ins. Aliq.-Cyprus | 1584LIII–1624P | 4275 | 241 | 440 | 14 | 81 | 521 | 12.2% |
| 9P. Italiae Vetus | 1584LIII–1624P | 4275 | 241 | 440 | 13 | 75 | 515 | 12.0% |
| 10P. Siciliae Vetus | 1584LIII–1624P | 4275 | 241 | 440 | 14 | 81 | 521 | 12.2% |
| 11P. Thusciae Antiq. | 1584LIII–1624P | 4275 | 241 | 440 | 15 | 86 | 526 | 12.3% |
| 12P. Pereg. Abrahami | 1590LIV–1624P | 3800 | 205 | 374 | 10 | 58 | 432 | 11.4% |
| 13P. Aevi Vet. Typus | 1590LIV–1624P | 3800 | 205 | 374 | 19 | 109 | 483 | 12.7% |
| 14P. Africae Propr. T. | 1590LIV–1624P | 3700 | 190 | 347 | 16 | 92 | 439 | 11.9% |
| 15P. Brittanic. Ins. N. | 1590LIV–1592L | 400 | 42 | 77 | 1 | 6 | 83 | 20.8% |
| 16P. Brittanic. Ins. S. | 1590LIV–1592L | 400 | 42 | 77 | 1 | 6 | 83 | 20.8% |
| 17P. Pontus Euxinus | 1590LIV–1624P | 3700 | 190 | 347 | 20 | 115 | 462 | 12.5% |
| 18P. Gallia vetus | 1590LIV–1624P | 3700 | 190 | 347 | 14 | 81 | 428 | 11.6% |
| 19P. Germania Vet. T. | 1590LIV–1624P | 3700 | 190 | 347 | 10 | 58 | 405 | 10.9% |
| 20P. Hispania Vetus | 1590LIV–1624P | 3700 | 190 | 347 | 13 | 75 | 422 | 11.4% |
| 21P. Italia Gallica | 1590LIV–1624P | 3700 | 190 | 347 | 16 | 92 | 439 | 11.9% |
| 22P.Typus Chorograph. | 1590LIV–1624P | 3700 | 190 | 347 | 15 | 86 | 433 | 11.7% |
| 23P. Pannonia | 1590LIV–1624P | 3700 | 190 | 347 | 10 | 58 | 405 | 10.9% |
| 24P. Tempe | 1590LIV–1624P | 3800 | 205 | 374 | 5 | 29 | 403 | 10.6% |
| 25P. Tracia Vet. Typ. | 1590LIV–1624P | 3700 | 190 | 347 | 18 | 104 | 451 | 12.2% |
| 26P. Europam Celtic. | 1595LV–1624P | 3400 | 156 | 285 | 9 | 52 | 337 | 9.9% |
| 27P. Gallia Vet. Typ. | 1595LV–1624P | 3400 | 156 | 285 | 9 | 52 | 337 | 9.9% |
| 28P. Latium | 1595LV–1624P | 3400 | 156 | 285 | 12 | 69 | 354 | 10.4% |
| 29P. Ital. Graec. Maior | 1595LV–1624P | 3400 | 156 | 285 | 8 | 46 | 331 | 9.7% |
| 30P. Daciarum Moes. | 1595LV–1624P | 3400 | 156 | 285 | 16 | 92 | 377 | 11.1% |
| 31P. Alexandri Magni | 1595LV–1624P | 3400 | 156 | 285 | 9 | 52 | 337 | 9.9% |
| 32P. Aeneae | 1595LV–1624P | 3400 | 156 | 285 | 6 | 35 | 320 | 9.4% |
| 33P. Daphne | 1595LV–1624P | 3400 | 156 | 285 | 4 | 23 | 308 | 9.1% |
| 34P. Brittanic. Insul. | 1595L–1624P | 3300 | 148 | 271 | 11 | 63 | 334 | 10.1% |
| 35P. Aegyptus Antiqua | 1595L–1624P | 3300 | 148 | 271 | 12 | 69 | 340 | 10.3% |
| 36P. Geographia Sacra | 1598F–1624P | 2900 | 134 | 244 | 10 | 58 | 302 | 10.4% |
| 37P. Erythreae | 1598F–1624P | 2900 | 134 | 244 | 9 | 52 | 296 | 10.2% |
| 38P. Argonautica | 1598F–1624P | 2900 | 134 | 244 | 8 | 46 | 290 | 10.0% |
| 39P. Escorial | 1601L–1624P | 3050 | 118 | 216 | 3 | 17 | 233 | 7.6% |
| 40P. Ordines Sacr. I | 1603L–1624P | 2250 | 97 | 177 | 7 | 40 | 217 | 9.6% |
| 41P. Ordines Sacr. II | 1603L–1624P | 2250 | 97 | 177 | 4 | 23 | 200 | 8.9% |
| 42P. Lumen Orient. | 1624P only | 300 | 20 | 33 | 2 | 12 | 45 | 15.0% |
| 43P. Lumen Occident. | 1624P only | 300 | 20 | 33 | 2 | 12 | 45 | 15.0% |
| 44P. Tab. Peutinger I | 1624P only | 300 | 20 | 33 | 3 | 17 | 50 | 16.7% |
| 45P. Tab. Peutinger II | 1624P only | 300 | 20 | 33 | 3 | 17 | 50 | 16.7% |
| 46P. Tab. Peutinger III | 1624P only | 300 | 20 | 33 | 3 | 17 | 50 | 16.7% |
| 47P. Tab. Peutinger IV | 1624P only | 300 | 20 | 33 | 3 | 17 | 50 | 16.7% |
| All Parergon maps | 142.375 | 7.298 | 13.303 | 480 | 2,765 | 16.068 | 11.3% | |
| Total of all maps | 873.000 | 49.717 | 90.768 | 3.747 | 18,735 | 112.338 | 12.9% | |
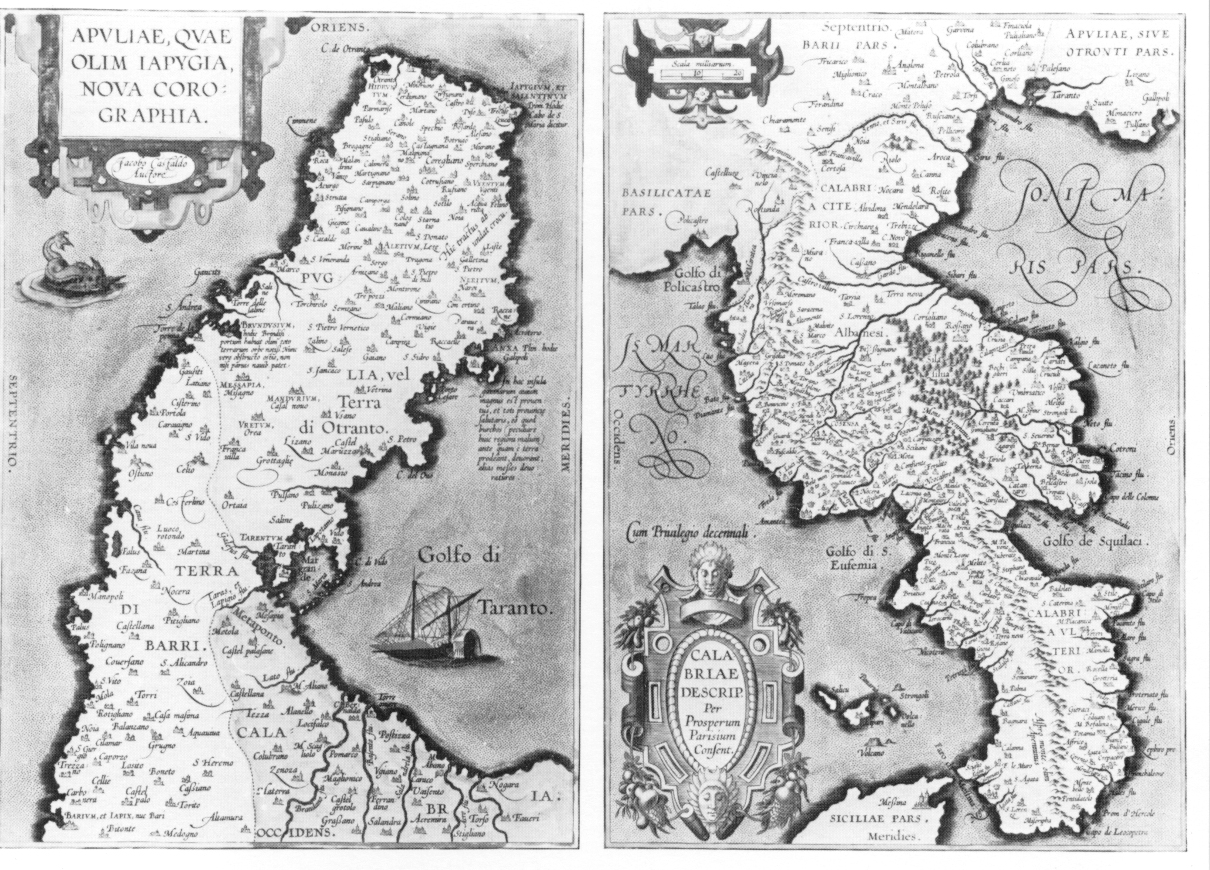
Some of the single page Ortelius maps are paired on plate, while others are printed from separate plates and combined on one mapsheet. Thus the map of Apulia appears with Calabria in one case, and with Padua in another.
Column 1. Koeman identification
This column contains the list of maps as distinguished and identified by number in Koeman (1969).
Column 2. Period of use of each map
Column 2 specifies the period over which a map was included in the Theatrum. For brevity, only the dates of first and last appearance have been given. However, this does not mean that the map was necessarily included in all intermediate editions. The data in this column (incorporating the occasional omission of a map from an intermediate edition) were obtained by checking in person the contents of all Theatrum editions in the major libraries.
Column 3. Estimated number of map copies printed
The third column provides an estimate of the total number of copies of each map printed, obtained by ascertaining in which editions the map occurs, and by multiplying each occurrence with the estimated impression of that edition (Table I, column 4). It will be noted that thirty-one maps occur in every edition giving an estimated total of 7,300 copies, whereas, on the other end of the scale, six maps (42P-47P) were probably printed in no more than 300 copies, since they only occur in one edition, viz. the 1624 Parergon.
Column 4. Maps extant in atlases, proved
Column 4 contains the number of copies of maps that have survived in atlases whose existence has been established in libraries or in circulation. Thus, the numbers in this column are reliable, if conservative.
Column 5. Maps extant in atlases, estimated
Column 5 adds those atlases supposed, but not observed, to be in circulation, during the period 1980-185. As before, we have multiplied the numbers from our sample period by a factor five, and added 10% for those undisclosed by dealers or with long-term private owners, cf. Table I, column 7.
Column 6. Loose maps in circulation, 1980-1985.
This column represents the heaviest time investment of this paper. It lists the number of occurrences of each map in public and dealer sales over the last five years. This data was collected in the same manner as described in Table I, column 6. Some problems that cropped up in the compilation of this list deserve mentioning. The often scanty description of individual maps for sale does not always allow identification if an early and a late version of the same area occur. Notable cases of this kind are 1 and 113 (World), 2 and 114 (America), 5 and 110 (Europe), 9 and 150 (France), 11 and 139 (North West France), 13 and 147 (Germany), 14 and 153 (the Low Countries), 16 and 126 (Brabant), 17 and 125 (Flanders), 27 and 140 (Austria), 32 and 112 (Italy), 50 and 92 (Turkey, Middle East), 57 and 149 (Ireland), 78 and 116 (Burgundy), 81 and 111 (Hannonia), 82 and 115 (Artois) and 104 and 114 (Prussia). The individual numbers for these maps may therefore be wrong, but their combined totals are right.
Another problem is presented by the unpredictable pairings of half-size plates. These were combined in different ways in different editions. This problem is aggravated by the fact that these maps are commonly offered for sale singly, i.e. as one folio size, although they derive from a double folio sheet which has been cut in two. If the map occurs on the left half of the sheet, the page number on verso and the language of the text normally allow identification, but if the map occurs on the right half of the sheet, this help is normally unavailable, since there is often no text on this half of the sheet, and never a page signature. Notable cases where this happens are plate(s) 64ab, 86ab, 101ab, 109ab, 129ab, 130ab, 131ab and 133ab. For more information see Table II, column 1 or Koeman (1969). In cases of doubt, half page maps have been entered under their most common pairings. Inevitably, this will have caused some distortion of the data.
Column 7. Loose maps in circulation
Column 7 contains an estimate of total number of loose maps in circulation. The reasoning that was applied to atlases has been followed here as well. Again, an average turnover time of twenty-five years is assumed. This period may in fact be shorter, since maps are less expensive than atlases, so that there is a wider public for them. Moreover, chances that maps have been counted more than once over our sample period because they were re-offered for sale are greater here than was the case with atlases. On the other hand, it must be conceded that the chances of missing a map that was offered over our sample period is greater than the chance of missing an atlas, so I adhere to twenty-five years as the average turnover time for loose maps. In addition to this, I have again assumed that 10% should be added to account for those maps that have been traded between dealers without leaving a visible record, and another 5% has been added to account for loose maps in libraries. Their existence is much harder to assess than that of atlases, which tend to feature more prominently in library catalogues. The figure of 5% is speculative, based as it is on personal impressions only.
Column 8. Total estimate of individual maps extant
When we add the number of maps extant in atlases (proved + estimated) to the number of loose maps in circulation (proved + estimated), we obtain an overall estimate of individual Ortelius maps that have survived. This estimate is given in column 8. It will be clear that Gròf's13 suggestion to locate all Ortelius maps still in existence is impracticable, interesting as his suggestion may be, given that there are probably about 112,000 of them (cf. bottom Table II).
Column 9. Survival percentage of individual maps
Again, survival rate of individual maps can be established by dividing the probable number of extant maps by their production numbers. It will be noted that survival rates for maps are higher than of atlases, since occurrence in atlas and loose form is combined. Despite widely varying impression rates for the individual maps (300-7,300), survival rates remain remarkably stable between 10% and 12%. It stands to reason that the interesting and valuable maps such as the World or the Americas score higher than regional maps of France or Italy or the Parergon maps, in which there is less interest. This does not reflect actual survival differences, but rather differences in value and in the interest shown by the map-collecting public. Yet, in view of the considerable consistency in survival rate, the estimates cannot be widely off the mark. When the overall conclusion is reached here that about 110,000 out of approximately 870,000 printed Ortelius maps have survived in atlases or loose form, or about one out of every eight copies printed, this conclusion is rather conservative. If my speculations and estimates err, they do so on the safe side and the true figure may be closer to one in seven.
Conclusion
In this article I have attempted to reach as fair an estimate on the production and survival of Ortelius atlases and maps as I could on the basis of documentation that is available or could be collected for the purpose. It will be clear that Skelton's14 estimate of 1,000 copies for the 1606E edition alone cannot be upheld under the evidence presented. When we see the somewhat lower than average survival rates of maps that only occur in the later editions, and 1606E was one of those, as compared to the earlier maps, my printing estimates for the later editions may still be on the high side. I leave it to the reader to do some recalculations when this is felt as a serious shortcoming.
In summary, the answer to our initial question - how many Ortelius atlases and maps were printed, and how many survived? - is as follows: approximately 870,000 maps were printed in about 7,300 atlases. 750 Additamenta and 600 Parergons. About 108,000, or 12% of these maps survived. Of these, about 90,000 survived in an atlas, and about 18,000 in loose form.
I would appreciate receiving any information which might modify or strengthen the data presented above, so that the conclusions based on them may become more solid than they are at present, and lead to a better knowledge about the quantitative aspects of the history of cartography.
References
- C. Koeman, The history of Abraham Ortelius and his Theatrum Orbis Terrarum. Introduction to the 1570 facsimile edition (Lausanne: Sequoia SA, 1964), p. 40.
- Map Collector Series 34 (1967 pp. 20-21, plates XI and XII; Weinreb and Douwma, London, Catalogue 7 (1971), no.2.
- R.V. Tooley, Maps and Mapmakers, 6th edition (London: Batsford, 1978), p. 22.
- R. A. Skelton, Abraham Ortelius. The Theatre of the Whole World, Facsimile of the 1606 English edition (Amsterdam: Theatrum Orbis Terrarum, 1968), p. XV.
- Denucé, Oud-Nederlandse kaartmakers in betrekking met Plantijn, 2vls 1912 (Uitgave der Antwerpsche Bibliophilen no. 28, reprinted by Amsterdam: Meridian Company, 1964), p. 164.
- Ibid, p. 55.
- Ibid, p. 181.
- R. W. Shirley, The Mapping of the World. Early printed world maps, 1472-1700 (London: Holland Press Cartographica, 1983 Vol IX), p. 145.
- C. Moreland and D. Bannister, Antique maps: a collector's handbook (London:Longman), pp. 202-203.
- R. V. Tooley, Maps of Palestine in the atlas of Ortelius, in The Map Collector 3 (1978), pp. 28-32.
- R.V. Tooley, Maps and Mapmakers, 6th edition (London: Batsford, 1978), p. 127.
- L. Gróf, Ortelius maps of Hungary, in The Map Collector 6 (1979), pp. 2-12.
- L. Gróf, Letter to h editor, in The Map Collector 24 (Tring: Map Collector Publications (1982) Ltd., 1983), p. 48.
- R. A. Skelton, Abraham Ortelius. The Theatre of the Whole World, Facsimile of he 1606 English edition (Amsterdam: Theatrum Orbis Terrarum, 1968), p. XV.
Acknowledgements
The work reported here would have been impossible without the help, advice and expertise of the many people I have consulted on the subject, though I remain fully responsible for any flaws. My gratitude goes in particular to Dr. Schilder who aroused my interest in the history of cartography in general, and in Ortelius in particular, to Dr. Koeman, Dr. Woodward and G. Noordzij for discussions on copper plate engraving and printing, to Dr. Wallis, Drs. Bos-Rietdijk, W. Groothuis, D. Zeinstra and J. Werner for allowing me to use their library facilities and providing assistance; to N. Israel and W. Germundsson for sharing their expertise on Ortelius maps, and to M. Samtleben and G. Reiss for their information on circulation rates. Helpful and informative remarks on an earlier version of this paper by Dr. Koeman, Dr. Voet, Tony Campbell, Dr. Woodward and Dr. Werner are gratefully acknowledged.